So you know that Stem and Leaf Plots are great at taking a big list of numbers and organizing them in an easy to read fashion. You might even know about how if there are lots of data points you can use a Split Stem and Leaf Plot to separate the data even further, giving you a more readable plot.
But what if you could double all this?
Back to Back Stem and Leaf Plots give you the ability to take two separate data sets and put them on the same plot. This allows you to compare the different data sets on one plot.
How Does a Back to Back Stem and Leaf Plot Work?
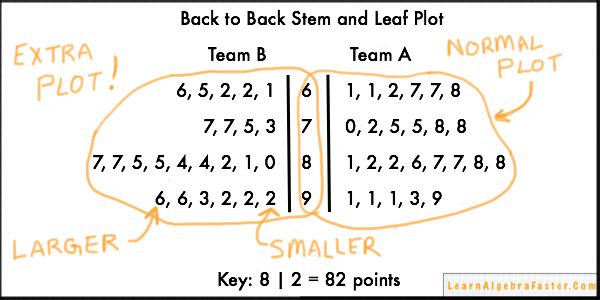
On a normal plot, the stem is on the left and all the leaves are on the right. There is a vertical line separating the two. On a back to back plot, the stem remains the same. But to add another set of data points, we begin adding leaves to the LEFT side.
Just like on a typical plot, the smallest leaves are placed closest to the stem, and larger leaves are further away. The stem now serves a double purpose. It anchors both sets of data points, keeping them separate but it still organizes both.
In a back to back stem and leaf plot, you can compare two sets of data, and still be able to find the statistical measurements of each set. It also retains the same pros and cons of a normal plot. In the picture above, you can see that the stems work for each side of the plot, yet the data is separate. We added the points for Team B, but we started building at the center of the plot. It is pointed out on the last line of Team B’s points that the smaller leaves are closest to the stem and the larger leaves are farther away. In this picture you can see that Team B scored 92, 92, 92, 93, 96, and 96, respectively. Note the locations of the “2” leaf and the “6” leaf.
What is different about a Back to Back Stem and Leaf Plot?

- You do not have to have the same number of data points on each side of the plot.
- The Key must work for both.
- Add stems as necessary to accommodate the new data points.
- You can still split the stems if you need to!
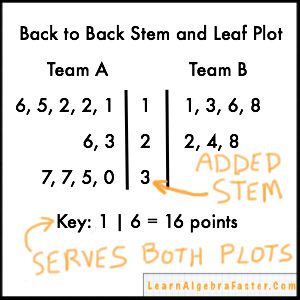
As you can see in the picture to the right, Team A has more data points than Team B. This is ok! It is not critical for them the have the same number of data points on the graph. Do not go crazy with this though. If one side of the plot has many more data points than the other, it will look odd. The purpose of the plot is to organize the data.
The second point is that the key must work for both sides of the plot. DO NOT mix units or try to save space by combining plots when they do not measure different things. Note that this plot compares Team A and Team B. They are playing the same game. If one team was playing basketball and the other was playing football, a back to back stem and leaf plot CANNOT be used.
Some times a back to back plot is avoided because the stems are not identical. Don’t abandon a back to back plot because of this. You can add stems to accommodate more data. But, as in the first point, do not go overboard with this. In this second example you will see how we added a “3” stem for Team B, but did not violate rules #1 or #2 by doing this.
I didn’t show in this example but you can even combine a back to back plot with a split stem and leaf plot if you want! This can be complicated so I will dedicate an article to this in the future.
Do you have anything you would like to see a post on? If so, email me or comment below.
