Split Stem and Leaf Plot

Stem and Leaf Plots do a great job of organizing a list of numbers into an easy to read format. But what happens when there are a LOT of numbers in a set? That’s where the Split Stem and Leaf Plot comes in handy.

A Split Stem and Leaf Plot takes an ordinary stem and leaf plot and “splits” the stem section into two entries. This way, instead of having many numbers in one leaf section, it is split into two separate categories. The most common way to do this is for the split stems to group leaves 0-5 in the first section and the 6-9 leaves in the second section. Take a look at the picture below:

Split Stem and Leaf Plot

Note that both plots are equal. They represent the same data set. However, you will see that the split stem and leaf plot separates each stem into two stems. We place the smaller leaves (0, 1, 2, 3, and 4) on the first part of the split stem, and the larger leaves (5, 6, 7, 8, and 9) on the second split stem.

This makes the plot more appealing, as we don’t have the section from 20 – 29 extending far past the other leaf sections. You can use split stems at your own discretion, but it is very important to make sure the stems are separated consistently.

Stem and Leaf Plot Key

Stem and Leaf Plot KeyStem and Leaf Plots are a great way to organize lists of numbers in an appealing way. They take long lists of data points and organizing them. But, as with any plot or graph, some context is needed. A Key (or Legend) is used with a stem and leaf plot to give this context.

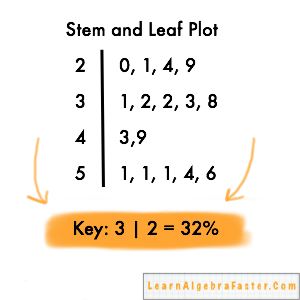
A stem and leaf plot key shows what a typical entry represents. If applicable, it will also show the units of measurement (percent, feet, inches, etc.). A key is also how you denote if the entries include decimal points.

A proper stem and leaf plot should ALWAYS have a key. The bad news is sometimes you must dig a little to find it. Sometimes it won’t be labeled as a “Key,” and sometimes you’ll have to read for clues in a word problem. Worse yet, sometimes a key won’t be included at all, and you’ll have to look at the actual number set to see what a typical entry looks like.

Stem and Leaf Plot Key Examples

  • Key: 3 | 2 = 32% – Denotes number and percentage
  • Key: 3 | 2 represents 3.2 seconds – Denotes decimal location and units
  • Key: 3 | 2 represents 32 meters – Shows number and units
  • 3 | 2 is 32 – This is the bare minimum, but is very common. (Note it is not even labeled “Key”)

The most common location for a key is centered under the plot, but there is no “standard” location. Keys can also be placed above, on the side, or mentioned in the context of a word problem.

What a Stem and Leaf Plot Key MUST Have

  • It MUST be there!
  • A “typical” entry
  • Units of measurement

Sometimes you will have to create a stem and leaf plot, either for a homework question or exam. Although most plots are easy to understand, you run the risk of losing points if you do not include these things. Remember, you don’t want to simplify a lot of data into an easy to read format just to confuse someone as to what each data point actually means.

If you have any other questions about these plots or keys, leave a comment below!

Stem and Leaf Plot Definition

Stem and Leaf Plot DefinitionStem and leaf plots are used to graphically show sets of data in a clear, visual way.

Instead of having many different numbers in a single list, these plots are used to order, organize, and gather statistical information from the set. Like most graphs, they make a complicated, unorganized mess of information and make it visually appealing.

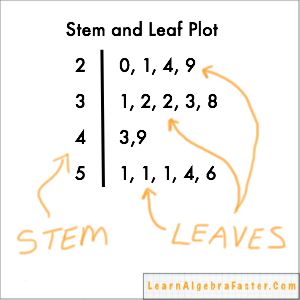
As the name suggests, there are two parts of the plot: the stem and the leaves.

On a standard stem and leaf plot the stem is on the left. It contains many numbers, ordered from smallest (top) to largest (bottom). A vertical line is drawn on the right side of the stem to separate the stem from the leaves.

The leaves are on the right side of the plot. Each number on the leaf side of the plot represents one single data point from the number set. They two are organized from smallest to largest, separated by commas.

Stem and Leaf Plot Pros and Cons

Pros:

  • Visually represents complicated lists of numbers
  • Can be used on one, two, and three digit numbers
  • Can be used on decimals
  • Can be used for money values (Dollars and Cents)
  • Can be used to find Mean, Median, and Mode (Statistical Measures)

Cons:

  • The numbers must be placed in order of lowest to highest
  • Not good if maximum or minimum numbers lie far away from the rest
  • Not great if there are more than one decimal place

Stem and Leaf Plots are a great way to organize lists of numbers. Click Here for more information on Stem and Leaf Plots, including how to construct them, examples, worksheets, quizzes, and more.